The Salk
Vaccine
The success of the polio
vaccines, like poliovirus causation, is "proved"
through interpretations of animal laboratory experiments, and
are thus subject to the same criticism as the animal
experiments for virus causation, i.e., animal experiments are
extremely harsh and thus are unrelated to the human polio
disease condition.
Vaccination success in humans
has also been "proved" through statistics
(epidemiology) gathered from hospitals which show polio
incidence declining as vaccination programs are implemented.
"Polio and the Salk
Vaccine" is one of the most highly promoted medical
images, a typical example:
...the epidemics grew steadily worse
each year, with the number of new cases climbing from
5,000 in 1933 to 59,000 in 1952. Salvation came in 1954
with the Salk vaccine...
"A Paralyzing Fear:
The Story of Polio in America"
The New York Times, March 4, 1999 (Film Review)
The story of the Salk Polio
Vaccine is highly touted by teachers, medical
representatives, and in popular, educational, and
news/medical media.
Salk Vaccine
Timeline, U.S.
1952, Jonas Salk discovered
his vaccine, though the technology was not new, being based on vaccines
utilized at least by the early 1930s.
March 26, 1953, the Salk
vaccine announced, after evaluation of 600 vaccinated
persons. (Jane Smith,
Patenting The Sun)
1954, during the large field
trial, 423,000 second-grade children were vaccinated (T. Francis, from Nathanson, Field's
Virology). At the
height of the great polio epidemic, children of age 6-9 had
become a primary susceptible group and this is said to be the
reason that second grade children were chosen. The high
susceptibility of infants below age 5 to toxic chemicals (formaldehyde and merthiolate were used in the Salk vaccine)
in addition to the harsh method of receiving virus particles
by injection, could have been another reason to chose age 7,
for age 7 is at the end of the range of infant nerve system
vulnerability due to a rapidly growth and myelination.
Nearing the height of the
epidemic, the susceptibles range extended from pre-school
children to include the age 6-9 and beyond. This is clearly a
function of the extreme nature of the epidemic (in terms of
the toxic theory). This extension occurred before the height
and after the height. Regardless, infants below the age of 5
always were a primary susceptible group.
The primary susceptible group
of pre-school children (infants) was not targeted for
vaccination against infantile paralysis in 1954 or 1955.
Beddow, p8, writes that within two hours of release of the
Francis
Report on April 12, 1955, the vaccine was licensed. JAMA, vol
158, no 14, p1249 reports April 12, 1955. However, A Paralyzing
Fear, Seavey, 1977, states that the Salk vaccine was licensed
by HEW in March, 1955. Seavey is apparently incorrect.
Large scale vaccination begins
April 12, 1955. The target age group is 6-9 years (Scheele, A.S., Shannon, J.A.,
"Health Implications In A Program Of Vaccination Against
Poliomyelitis", JAMA, August 6, 1955).
The Cutter Laboratory disaster
is discovered 13 days later, April 25, 1955. Documented cases
caused by the Cutter vaccine were 79. The EIS went on to find
204 polio cases with 11 deaths out of the approximately
423,000 persons inoculated with Cutter's Salk vaccine (Jane Smith, Patenting The Sun,
1990). Contagion patterns
are very difficult to discover with polio, yet the EIS
expanded the original 79 cases to 204 by assuming contagion
patterns. Tremendous publicity was given to these cases.
April 27, 1955, Surgeon
General calls Cutter for a recall of its vaccines (Jane Smith, Op. Cit.).
May 8, 1955, the entire U.S.
vaccination program was cancelled by the Surgeon General (Christopher J. Rutty, Dept. History,
U. of Toronto, URL:http://www.eskimo.com/~dempt/salk.htm).
The program was soon resumed and 5,394,000 persons were
vaccinated during 1955.
During 1956, approximately
25,000,000 persons were vaccinated. The 1959 CDC Polio Packet indicates only the cc's of vaccine shipped per month, not
persons vaccinated. However, it gives enough information so
that the persons vaccinated can be interpolated from these
shipment figures.
1956, the federal government
rigorously tested the vaccine, and began to take over NFIP's
role.
1957, the vaccination program
resumed under CDC/EIS control and was highly promoted (Jane Smith, Op. Cit.). Approximately
31,300,000 persons were vaccinated in U.S. (CDC, Polio Packet, 1959)
1958, approximately 15,700,000
persons were vaccinated.
As of 1959, less than half of
the usual primary susceptible group (infants below age 5)
were vaccinated. Only 55% of those below age 40 were
vaccinated, according to the CDC's Polio Packet. 28%
of the vaccinations had been given to non-susceptibles, the
group of 40 and above.
However...
Polio incidence began its
sharp plummet in 1952. This is 3 years before the vaccine
was licensed by HEW in 1955. Thus, the Salk polio vaccination
did not significantly correlate with declining polio
incidence. However, a significant correlation with declining
polio incidence is found with reports in 1952 that nursing
cow calves were dying with of symptoms and physiology when
their mother's were fed fodder that had been treated with
DDT.
The plummet also correlates
with the 1951 government/industry debate over pesticide
safety.
The plummet also correlates
with the phase-out of persistent pesticides production in the
early 1950s. ("Persistent" pesticides are those
which do not easily biodegrade, such as DDT, BHC, arsenic
compounds, and lead compounds.)
Dr. Thomas Francis did not
mention in his key evaluation of the 1954 Salk field trials
that those who contracted polio after their first inoculation and before their second inoculation were placed
in the "not-inoculated" list.' (Maurice B. Bayly, The Story Of The
Salk Anti-poliomyelitis Vaccine, 1956). During the 1954 field trials second
graders only were inoculated, and 1st and 3rd graders used as
controls, yet susceptibility to polio (or toxicity) can be
highly variable between the ages of 6 to 7 to 8, and as such,
this made proof of success difficult.
During the 1954 field trials
only volunteers were inoculated, yet the control groups
included non-volunteers. This enters even more complex
variables into the trial. (Beddow, p14)
Jonas Salk worked for Francis
in his laboratory. Francis was a former Army epidemiologist
who was involved in U.S. studies of Nagasaki and Hiroshima
after the nuclear bombardment. Those studies have been
characterized as inaccurate:
...the National Academy of Science...
released a new report... the 'BEIR V' report, concludes
that cancer and leukemia risks for the survivors... has
been underestimated by a factor of three to four, due to
faulty dose estimates and insufficient follow-up study of
the survivors."
...the BEIR report suggests...
legitimate questions about the validity of the currently
accepted estimates. (Jay Gould et
al, Deadly Deceit: Low-Level Radiation, High-Level
Cover-up (1991), p179)
Though vaccination safety was
said to be a matter of record, the weekly polio case rates
during 1955 show a definite rise in polio case rates during
the period of vaccination (April and May), unlike previous or
subsequent years. This is not discussed, however, downward
movements in the age 7 group (in the age distribution graphs)
were used by the CDC to show evidence of vaccination efficacy
(CDC, Polio Packet,
1959).
The Detroit Epidemic, 1958
In 1958, laboratory analyses
of the epidemics in New Jersey and Detroit associated
poliovirus with only 56% of diagnosed cases. The Detroit
analysis associated only 51% of diagnosed polio with
poliovirus.
Regardless of these
associations, a positive finding for the poliovirus would not
by itself prove poliovirus causation because this virus is
often found during epidemics in those who have no disease
symptoms or in those who have disease symptoms that can be
attributed to other microbes (Scobey, "Is Human Poliomyelitis Caused By
An Endogenous Virus?", Science, v71, 1954).
Detroit
Epidemic, Microbe Analysis
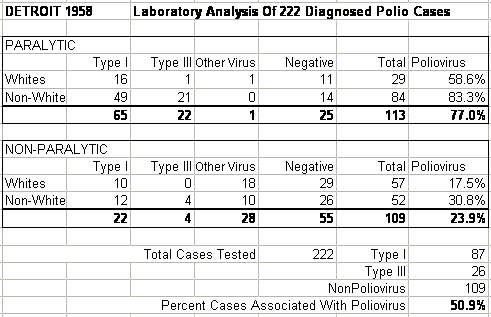
47% of the diagnosed polio
cases in the Detroit epidemic were found to have been
inoculated at least once, 34% at least twice, 22% at least
thrice. Non-white cases had been found vaccinated 54% as much
as white cases, however, according to the CDC's Polio
Packet, non-white to white paralytic case incidence was
18 to 1, or 1800%:
The epidemic was the second worst in
Detroit history. Paralytic cases were 18 times more
frequent among non-whites... (Sect.
VII, p17, 1959)
A check on these calculations
shows the incidence ratio of non-whites to whites actually to
be just over 13 to 1, which is intriguing enough. The base
numbers are as follows. For those who would like to check for
themselves, the non-white to white paralytic cases were 246
to 66. Non-white to white population was 420,000 to
1,480,000). The result, an incidence ratio of 13 to 1, has been applied to the
considerations below, which gives a break to orthodoxy. At
the time the Polio Packet was published, during the
epidemic, the "18 times more frequent" phrase
enhanced the imperative for vaccination, since these
non-whites were lagging in their vaccination status.
The poliovirus now appears to
be unreasonably selective for non-whites. There are many
mitigating factors that could be brought to argue against
these general impressions. Thus it is necessary to proceed
into detailed comparisons.
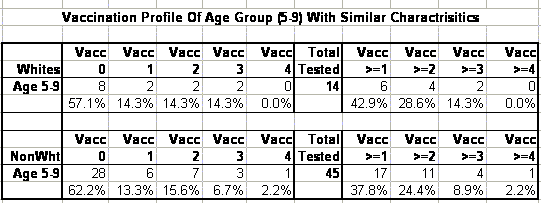
Age Group 5-9: White
vs Non-White
Consider a comparison of the
most similar age group, e.g., school children in the age
group 5-9. These children were similar in education level,
age, and vaccination status. Only the paralytic cases are utilized in this comparison because they were much more
frequently associated with poliovirus: 77% of the paralytic
cases were associated with poliovirus, yet only 24% of the
non-paralytic cases were associated with the poliovirus.
In the 1950s, clinical doctors
diagnosed polio according to symptoms and physiological
evidence. Only a small percent of total cases in the U.S.
were analysed in the laboratory for presence of the
poliovirus. If the poliovirus could not be associated with a
case then it was set aside as non-polio. Suddenly, much of
the disease called polio was technically not polio. How is
that so much non-poliovirus polio rose and declined
concurrently with poliovirus polio during the Great Epidemic?
No vaccine existed for non-poliovirus polio.
Without pursuing that
quackmire, we continue here within the
slippery orthodox definitions of polio and limit our focus to
paralytic polio in order to deal within a set of cases which
can at least be assumed to be mostly poliovirus caused --
just in order to be able to argue the shifting orthodox
assumptions.
Regarding the comparison of
non-white vs white age group 5-9, we first find that the
non-white to white paralytic case ratio is 3.2 to 1.
Converted to incidence, which accounts for population
differences, we have an incidence ratio of 11.3 to 1.
This vast disparity cannot be
explained by vaccination status because these were quite
similar. Non-whites were found to be vaccinated 88% as much
as whites. Based on this, if polio vaccination was valid, we
would expect an incidence ratio between the two groups to be
closer to 1.1 to 1, than 11.3 to 1.
The vaccination profile of
these cases is provided in the following table:
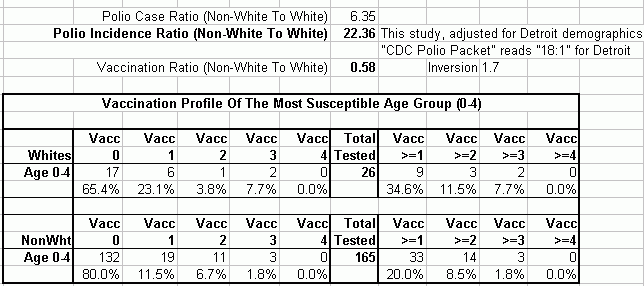
Age Group
0-4: White vs Non-White
The second
comparison group is pre-school children in the age group 0-4.
These polio cases are, at the least, similar in age, and not
very dissimilar in vaccination status. Another similarity is
that they both represent the traditionally highest
susceptible age group, from whence comes the name
"Infantile Paralysis".
The non-white to white case
ratio is very different, 6.3 to 1. Converted to incidence, using
demographics for this era, an
even more stunning incidence ratio is found, 22.4 to
1. This is close to the CDC statement for Detroit, "Paralytic
cases were 18 times more frequent among non-whites...". (Polio
Packet 1959, p VII, 1)
Yet, this study finds non-whites vaccinated
0.58 as much as whites.
If vaccination was a valid concept then the
expected incidence ratio should be closer to 1.7 to 1
than 22.4 to 1. A coefficient of logical disparity would then be
22.4x0.48, that is, 12.99. CDC should have explained this disparity,
or refocused their study towards Detroit's environmental hazards and
non-white neighborhoods.
The vaccination profile of the
0-4 cases is provided in the following table. Note that the
Vaccination Ratio is found by taking the cumulative vaccination count for
non-whites (see chart) and dividing that by the cumulative vaccination count
for whites, that is, 34.6%.
Poliovirus theory creates
massive contradictions between public images, epidemiological
data, and laboratory data.
The toxic theory can easily
resolve these contradictions.
For instance, with regards to
the Detroit epidemic a study might begin with a focus upon
the industrial pollution of drinking water, extraction
solvents in cooking oils, and pesticides in cooking oils
(particularly those, which in fine print show their
ingredients to include cottonseed oil). Pesticides and
herbicides in fatty meat and dairy products should also be
analyzed for toxic chemicals. The polio victims should be
studied for levels of industrial toxins in their urine,
tissue, and in nursing mothers, breast milk. The Polio
Packet shows the epidemic peaks in Detroit occurring
somewhat later for non-whites, which is consistent with the
later harvest time of the cotton crop vs other crops. A
similar epidemic shift occurred in a white community in
Massachusetts in 1908, where an epidemic centered around
three cotton mills.
It is unlikely, in my opinion, but if dietary and toxicology studies
were found negative, then a
bacterial hunt could begin. If that proved negative, then
viropathologists could possibly find rogue, nucleic acid as
the culprit. And lastly, if all else fails, it could be
asserted that the polio epidemic was caused by genetic
defects in the population, with packaged salvation available
from biotech industry's nearest representative.
Pesticides
vs Polio vs Salk
In essence, the Salk
Vaccination program appears irrelevant to the Great Polio
Epidemic, as shown in the following graph which represents
vaccination data from the above timeline.
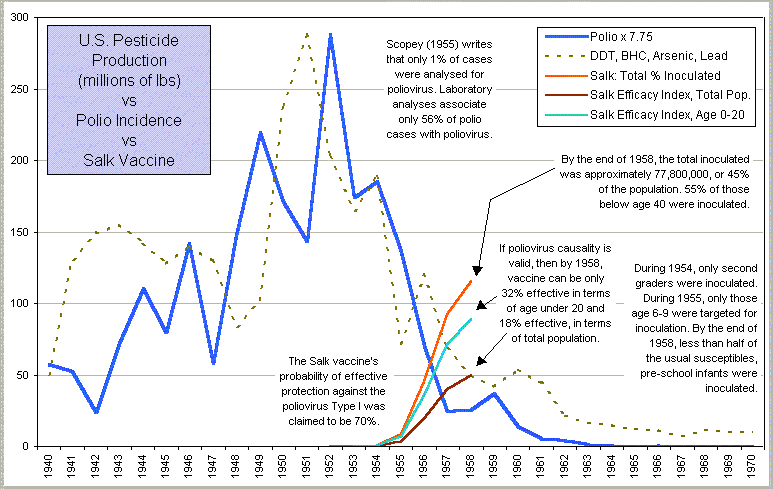
With regard to polio
incidence, the Salk vaccine shows less impact (if any) than
we have been lead to believe, especially when compared to the
nearly perfect correlation of the persistent pesticides,
which spans a much longer period, and maintains a direct
correlation throughout a complex series of oscillations, and
not only in terms of this composite graph, but in terms of
each pesticide.
Internationally, the
pesticides, polio, and vaccination programs co-exist under an
organized central leadership, such as in Mexico, which is
decades behind the U.S. in terms of pesticide regulations.
In 1994, W.H.O. gave Mexico a
low rating for polio, characterizing it as a "Stage
C" country. That is, it has ongoing polio cases and
ongoing vaccination programs. (Van Nostrand's Encyclopedia of Science and
Engineering, Van Nostrand Reinhold, 1995, p2492)
Coincidentally, the North
American Working Group on Sound Management of Chemicals, a
NAFTA group,
...will finalize action plans aimed at
reducing mercury, PCBs, DDT and chlordane in the North
American environment. The action plan requires Mexico to
reduce and eliminate, within a specific timeframe, the
use of DDT in malaria control. Chlordane will also be
phased out in Mexico. (Kevin G.
Hall, Journal of Commerce and Commercial, Nov 4,
1996 v410)
The phrase "DDT in
malaria control" indicates the presence of W.H.O.
Worldwide polio vaccination
programs and industrial pollution continue concurrently.
Post-Polio
If polio vaccination theory
were valid, then in terms of orthodoxy, former victims of polio
would not be able be infected with poliovirus, except when
infected with a poliovirus type to which they have not been
previously exposed. However, several studies have found
evidence of poliovirus (including the common Type I) in
post-polio victims (see PubMed
listings). It is
likely that these post-polio victims were previously exposed
to the Type I poliovirus because most polio victims suffer
from post-polio (approximately two-thirds) and Type I is
common.
Generally, virus association
with disease can be expected because viruses are more apt to
proliferate in poisoned biological systems.
The most consistent
correlation which contributes understanding to post-polio is
pesticides -- just previous to the first reports of
post-polio (March, 1984), U.S. legislation allowed for the
re-entry of DDT in pesticide blends (June, 1983).
Conclusion
Because
Pesticide symptoms and
physiology are identical to poliomyelitis.
and pesticide
dosage arguments alone
suffice,
and epidemiological proofs for
pesticide causation correlate perfectly.
And because
Poliovirus proofs, based on
animal brain injection experiments, are artifacts of the laboratory and cannot transcend
this limitation,
and polio contagion among
animals in the laboratory is unknown,
and poliovirus can easily
infect benignly, yet the paralytic disease shows no pattern
of contagion,
and vaccination proofs are
based on harsh laboratory experiments that do not reflect the
human experience,
and vaccination
epidemiological evidence is relatively irrelevant,
and poliovirus presence in post-polio invalidates vaccination theory,
and poliovirus presence is not
required for the polio disease,
and in spite of an extremely
biased scientific environment ranging from textbook warning
statements regarding the mere consideration of pesticide causation, exclusively biased public health laws, exclusively
biased funding, and dramatically charged global propaganda
for the public and medical professional,
We are able to
conclude with the most direct explanation: Pesticide causation.
Addenda: Testing The Pesticide Theory
A theory is only as good as
its ability to predict events.
Accordingly, the poliovirus
theory is a non-theory, because the poliovirus has always
been associated with humans and thus its presence predicts
nothing.
The pesticide theory, however,
correlates perfectly in all data areas. It correlates a
historically new event (pesticide poisoning), with another
new event (poliomyelitis). It simply correlates dosage with
physiology and symptoms.
Billions of dollars have
funded the development of the poliovirus theory since Landsteiner and Popper in 1908. Zero dollars have funded the pesticide
theory. Yet, after the smoke has settled, the simple
pesticide argument remains strong.
The pesticide theory can be
used by historians as a tool for the discovery of evidence of
mass poisoning. In the table below are examples of such use:
| Polio
Epidemic |
Pesticide
Event |
| 1887:
The first polio epidemic (Sweden) |
1873:
Patent of first pesticide sprayer
1874: invention of DDT
1874-1887: first relatively large group of pesticide
developments. |
| 1908: A
polio epidemic within northwestern, Massachusetts
that occurred in three manufacturing towns, all
within 20 miles of each other. A thorough study in
1909 concluded that polio is non-contagious, and that
the port of entry for the virus is probably food,
milk, and water. No exclusively breastfed infant
acquired polio. By far the highest polio incidence
was in an upstream town with 3 cotton mills. No
toxicological investigation was made. As usual, the
gathering of data was based upon the infectious
disease model. |
1907:
The first high-volume production of carbon
tetrachloride begins in the U.S. Carbon tet was used
as a fumigant, insecticide, herbicide, and cleaning
solvent. Used in cottonseed oil extraction.
Cottonseed byproducts can be used in dairy fodder. |
| 1916:
The polio epidemic in NYC region |
1915,
Hooker Chemical and DOW begin first high-volume
production of chloral benzene, at Niagara Falls. 8,500
metric tons per year. |
| 1921:
FDR acquired polio in the Bay of Fundy, off the
remote island of Campobello, Canada. |
Campobello
is directly downstream from several major industries
that dumped organochlorines, lead, arsenic, and
mercury. 1972, the Bay of Fundy was the chosen as the
site for an study of high DDT levels in porpoises. |
| 1942-1962:
The Great U.S. Polio Epidemic |
1942-1962:
Referred to as the era of "Pesticides As
Panacea". |
| 1945:
U.S. troops in the Philippines: Polio epidemics took
casualties second only to battle casualties. |
Troops
in Philippines were doused with DDT. Surrounding
population was unaffected by polio. |
| 1958: Polio epidemic
(136 victims) in New Jersey (Essex, Hudson, Bergen
Counties) |
The CDC PolioPacket
(1959) omitted describing the environment, which
included the area of the Bayonne and Linden petroleum
refineries. Nevertheless, the prime focus (lab work)
revealed that the poliovirus could only be found in
65% of the victims. Their "polio" had to be recategorized, thus driving the polio incidence down
immediately. |
1952: Philippines, polio epidemics.
1964: Philippines, 383 humans and 25,000 dogs per
year died of rabies. Rabies is a paralytic CNS
disease, physiologically and symptomatically similar
to polio, with a different virus assigned to it.
Landsteiner was originally quoted as observing the
similarities and has been criticized for that
opinion. |
Philippines,
under W.H.O. policy, continues with DDT/BHC for
agriculture and DDT for malaria anti-mosquito
campaigns. |
| India:
Continues with high polio incidence. Human rabies
deaths are estimated to be 10,000 per year (circa
1980). |
India as
of 1980 used persistent pesticides and has lagged far
behind developing countries in banning these. |
| Underdeveloped
and developing countries continue with polio
epidemics. |
Underdeveloped
and developing countries continue with persistent
pesticides. |
| Sri
Lanka has high polio rates and the highest rabies
rate in the world, 140 human deaths out of 11.5
million population per year (circa 1980). In 1980,
the U.S. had a population of approximately 360
million with a rabies incidence per year of from 0 to
2. |
Sri
Lanka ranks among countries with highest rates of
acute pesticide poisoning, and in 1980 allowed DDT
imports. As of 1995, DDT is listed as banned in Sri
Lanka, according to PANNA. |
| June,
1983: U.S. legislation allows re-entry of DDT for use
in insecticide blends. |
March,
1984: Post-polio is recognized as an emerging
epidemic in former polio victims. Post-polio cases
today are estimated to be 600,000. |
| Nigeria (Africa):
2003-2004, highest polio case count worldwide. |
WHO designates Nigeria
its #1 target (worldwide) for DDT malaria campaigns. These
campaigns were not in effect for many years prior. |
PANUPS (5/19/95) reports:
In Paraguay, an extensive 1990/91 study
of paralysis of the limbs in children, originally thought
to have been brought on by polio, suggested that monocrotophos [OP pesticide] drift from nearby cotton
fields was the most likely culprit.
Other Examples
The irrationality of vaccination
programs extends far beyond polio. Smallpox, claimed to be
virus caused and the first disease conquered by vaccination,
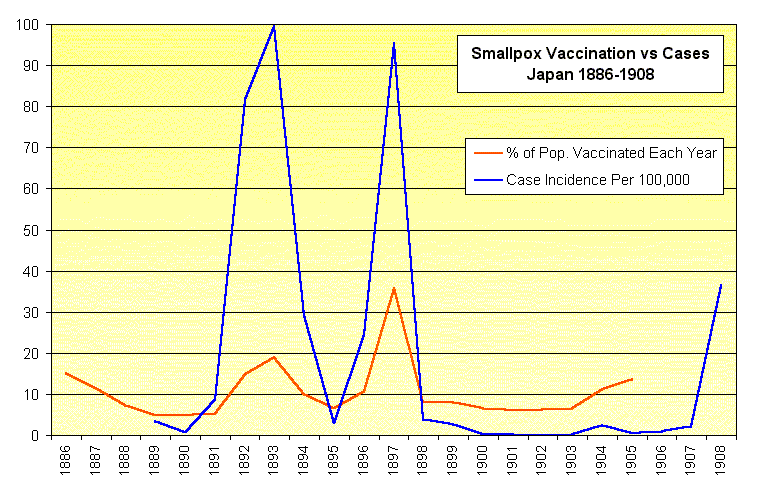
provides us with data for a strong anti-vaccination stance.
The following graph is generated from two tables found in the
bibliography of John Pitcairn's, The Fallacy Of
Vaccination (1911):
If one is searching for
evidence of causation then vaccination obviously causes
disease. Similarly, this is found to be so in the next
example.
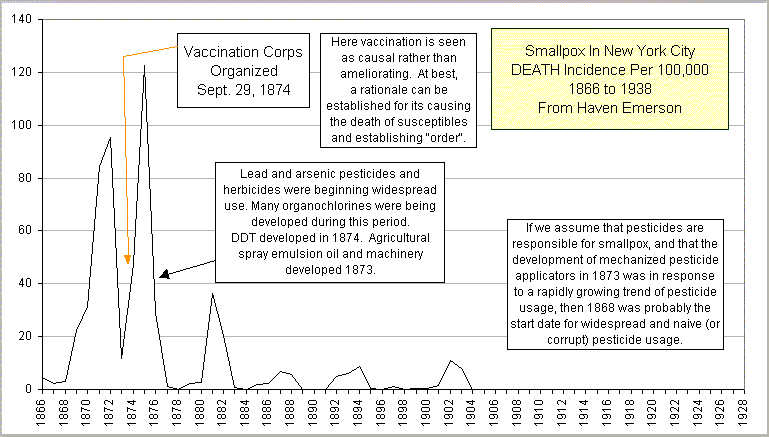
Before discovering the following
smallpox data from Emerson's epidemiological compilations of
New York City, I was under the impression that Western
pesticide usage had begun approximately 1873. The following
epidemiological chart convinced me that the date must have
been closer to 1868. Later, I found in Zimmerman et al, DDT,
Killer of Killers that 1869 is the date for first
pesticide implementation in the West (though there are
earlier instances, see Pesticide Introductions), thus demonstrating again how epidemiology can
be used to discover data regarding pesticide production and
population exposure. To this day, pesticide production data
is repressed by government and industry.
Summary Hypothesis
Vaccinations, and proofs
of virus causation, are similar phenomena. They both use
injections of virus material to provide images of a context
of impending toxic doom to the body. Before the wholly
artificial event of injection existed, impending toxic doom
was the only interpretation available to the body for the
presence of large amounts of virus -- in view of the cellular
S.O.S. response to toxicity, described in the Overview. Thus, the presence of exceedingly large
amounts of injected virus material should be expected to
generate a radical response: inflammation, proliferation of
viruses, genetic recombination, and the self destruction of
tissue, tissue which would be regarded as portals of entry --
for poisons. It should not be expected to generate such a
radical response repeatedly, because the body learns not to
be tricked. Thus we have "immunization" and
artificial proofs of its efficacy.
The Challenge
Modern Medicine is hereby
challenged to find a polio epidemic that was not
preceded by mass poisoning. It is further challenged to
include toxicological data in its reporting of disease. The
chemical industry is challenged to allow tracking of its
production and distribution. The laws forbidding
dissemination of pesticide production data should be
repealed. All pesticide use (place, date, type, quantity,
purpose) must be registered and toxic chemical content in
food should be labeled. The same goes for genetically
engineered crops. Pesticide registration would facilitate
epidemiology, making it truly meaningful and useful.
Anti-Vaccination Links
Since the 18th century, vaccinations
have caused extensive death and disablement, and their
promoted value is arguable. For more information refer to the
following list of sites which represent concerned citizens,
medical people, and parents. Some sites are touching
cyber-memorials for deceased children, placed lovingly by
their parents:
A
Shot In The Dark
Allergy
induced Autism
AltVetMed
Vaccination Decisions
Arizona
Vaccine Information Network
Association of
American Physicians and Surgeons
Australian Vaccination
Network
Autism and
Mercury
Autism
and Vaccination
AVN
Lithgow
BAFFLING
VACCINATION FACTS
Be
Informed About Vaccinations
Biological
Manipulation of Human Populations
British
Anti-Vivisection Association
Catherine
O'Driscoll - re Steve Dean in Dog World
Concerned
Parents for Vaccine Safety
Current
Childhood Vaccination Programs: Do They Cause More Disease
Than They Prevent?
Cyber-Pet
"Vaccinosis"
Dangerous
Vaccines
Dispelling
Vaccination Myths (1)
Dispelling
Vaccination Myths (2)
Do
Vaccines Cause Cot Deaths? - Harris Coulter
DoctorYourself.com
- Vaccinations
Dr.
Archie Kalokerinos
Dutch Pro-Choice
Vaccination League
Explore and Discover the
Research Of Tetrahedron
Freedom of Choice in
Healthcare Canada
French
National League for Freedom in Vaccination
Hallelujah
Health Tip #96
Hallelujah
Health Tip #97
Healing Arts
Health
Hazards of Vaccines
Health World On
Line
Healthier
Children Page- Himley Chiropractic
Hep
B Vaccine Damage List
His name
is "Hank"
Homeopathy and
Vaccination site by Dr. Tinus Smits
How
Vaccinations Work (Gary Null)
Immunisation
Awareness Society
Immunisation Awareness
Society (IAS)
Immunisation
Policy
Immunizations:
Make an Informed Choice!
Infant
Vaccination: A Biological Assault?
Informed
Parents Vaccination Home Page
International
Advocates for Health Freedom (IAHF)
Intuitive
Parenting
Justice,
Awareness and Basic Support
Komeshak
Chiropractic
Koren Publications
Leading
Edge Vaccine Paradigm
Lethal
Dangers of the Billion Dollar Vaccine Business
Lethal
Injections
LIFE
SOURCE
Lois Hoffer's
Vaccination Links
Missouri Citizens
Coalition for Freedom in Health Care
Myths
of vaccination, vaccines and immunization
National Vaccine
Information Center
Natural
Immunity Information Network
NEW ATLANTEAN
IMMUNIZATION & VACCINE BOOKS
New Hampshire
Libertarians Against Compulsory Vaccinations
Nosode Vaccination
Parents Requesting Open
Vaccine Education (PROVE)
Pennsylvania
Parents for Vaccine Awareness
People
Advocating Vaccine Education (PAVE)
Pesticides and Polio:
Graphic documentation regarding epidemiology and physiology
of polio.
Production
of Mass Behavioral and Neurological Problems Using
Vaccination to Increase Social Control
Well
Within's Earth Mysteries & Sacred Site Tour (Sheri
Nakken)
Shaken Babies
or Vaccine Damage?
Shoemaker & Horn
SIDS and Childhood
Vaccines-Is There A Connection?
Testimony
of Bernard Rimland, Ph.D.
The Eagle
Foundation
The
IVY League Foundation
The Law of
Vaccination - Toward Radical Reform
The Law of
Vaccination-Toward Radical Reform
The
Vaccines
THINKTWICE Global
Vaccine Institute
Vaccinating
Children: Where Do We Draw the Line?
Vaccination
Vaccination
Action File
vaccination
and its victims
Vaccination Awareness Network
UK
Vaccination
in Animals
Vaccination
information links
Vaccination
Information Service
Vaccination
Information South Australia (VISA)
Vaccination:
A Sacrament of Modern Medicine
Vaccinations
: The Facts!
Vaccinations
and Their Side Effects
Vaccinations
and Vaccinosis
Vaccinations
safe?
Vaccinations:
What You Don't Know Could Hurt Your Children
Vaccine
alternatives
Vaccine Information and
Awareness
VACCINE
INFORMATION ARCHIVE
Vaccine
Manufacturers and Breast Implant Manufacturers: Same Game,
Same Strategies. A Mere Coincidence?
Vaccine Safety
Vaccine,
Vaccinations, Immunization, Polio, DPT, MMR, …
Vaccines:
Offering Individuals Choice & Education
VacciNetwork (Italian
and English)
Well Within
What Doctors Don't Tell You
What
you don't know can hurt your children
Woodlands Healing Research
Center
Home Page
*
* *
(c) HARPUB 1997-1999
All Rights Reserved